\documentclass[a4paper]{article}
\usepackage[utf8]{inputenc}
\usepackage[brazil]{babel}
\usepackage{pgfplots}
\usepackage{tikz}
\begin{document}
\section{Gráficos}
No decorrer da nossa vida acadêmica nos deparamos várias vezes com a situação em que temos que expor informações, dados de forma gráfica. O LaTeX dispõe de uma excelente ferramenta para isso: o \emph{PGFPLOT}. Esta ferramenta riquíssima nos permite produzir gráficos interessantes.
\newline
A seguir temos uma sequência de gráficos
\subsection{Jogabilidade \emph{vs} Classificação}
\begin{tikzpicture}
\begin{axis}[xlabel=jogabilidade,ylabel=classificação]
\addplot+[gray,domain=1:30]
{0.5 + 0.5 * ((atan(x) * 2 / 180)^11.79)};
\end{axis}
\end{tikzpicture}
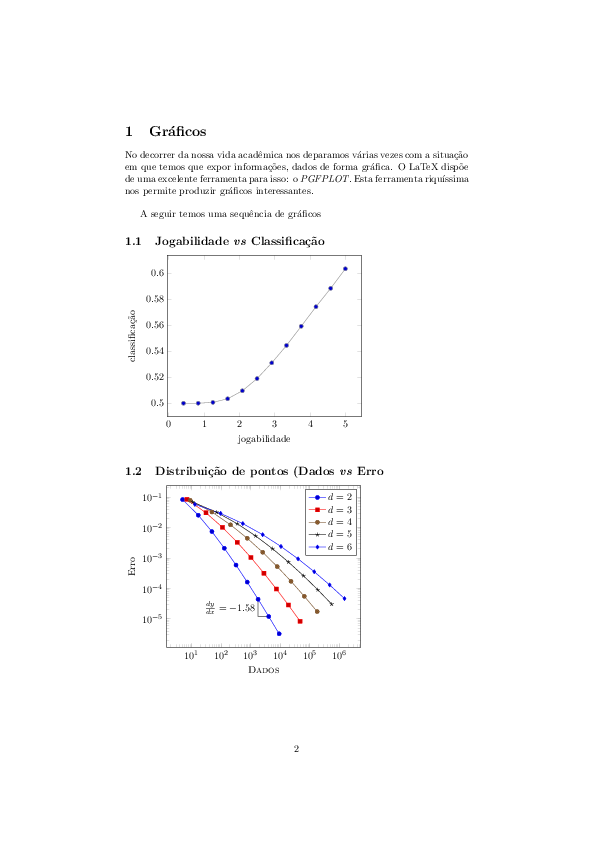
\subsection{Distribuição de pontos (Dados \emph{vs} Erro}
\begin{tikzpicture}
\begin{loglogaxis}[
xlabel=\textsc{Dados},
ylabel= Erro
]
\axispath\draw
(7.49165,-10.02171)
|- (8.31801,-11.32467)
node[near start,left] {$\frac{dy}{dx} = -1.58$};
\addplot plot coordinates {
(5, 8.312e-02)
(17, 2.547e-02)
(49, 7.407e-03)
(129, 2.102e-03)
(321, 5.874e-04)
(769, 1.623e-04)
(1793, 4.442e-05)
(4097, 1.207e-05)
(9217, 3.261e-06)
};
\addplot plot coordinates {
(7, 8.472e-02)
(31, 3.044e-02)
(111, 1.022e-02)
(351, 3.303e-03)
(1023, 1.039e-03)
(2815, 3.196e-04)
(7423, 9.658e-05)
(18943, 2.873e-05)
(47103, 8.437e-06)
};
\addplot plot coordinates {
(9, 7.881e-02)
(49, 3.243e-02)
(209, 1.232e-02)
(769, 4.454e-03)
(2561, 1.551e-03)
(7937, 5.236e-04)
(23297, 1.723e-04)
(65537, 5.545e-05)
(178177, 1.751e-05)
};
\addplot plot coordinates {
(11, 6.887e-02)
(71, 3.177e-02)
(351, 1.341e-02)
(1471, 5.334e-03)
(5503, 2.027e-03)
(18943, 7.415e-04)
(61183, 2.628e-04)
(187903, 9.063e-05)
(553983, 3.053e-05)
};
\addplot plot coordinates {
(13, 5.755e-02)
(97, 2.925e-02)
(545, 1.351e-02)
(2561, 5.842e-03)
(10625, 2.397e-03)
(40193, 9.414e-04)
(141569, 3.564e-04)
(471041, 1.308e-04)
(1496065, 4.670e-05)
};
\legend{$d=2$\\$d=3$\\$d=4$\\$d=5$\\$d=6$\\}
\end{loglogaxis}
\end{tikzpicture}
\subsection{Parábola simples}
\begin{tikzpicture}
\begin{axis}[
axis x line=bottom,
axis y line=middle,
xlabel=$x$,
ylabel={$x^2$},
xmin=-4, xmax=4,
ymin=0, ymax=4,
width=0.8\textwidth,
height=5cm
]
\addplot[mark=noner,smooth,domain=-1:1]{x^2};
\end{axis}
\end{tikzpicture}
\subsection{Pontos plotados}
\begin{tikzpicture}[only marks, y=.5cm]
\draw plot[mark=*,xshift=-6cm] file {data/ScatterPlotExampleData.data};
\draw[->,xshift=-6cm] (6,0) -- coordinate (x axis mid) (17,0);
\draw[->,xshift=-6cm] (6,0) -- coordinate (y axis mid)(6,27);
\foreach \x in {6,8,10,12,14,16}
\draw [xshift=-6cm](\x cm,1pt) -- (\x cm,-3pt)
node[anchor=north] {$\x$};
\foreach \y/\ytext in {0/0,2.5/5000,5/10000,7.5/15000,10/20000,12.5/25000}
\draw (1pt,\y cm) -- (-3pt,\y cm) node[anchor=east] {$\ytext$};
\node[below=1cm] at (x axis mid) {Education};
\node[left=2cm,rotate=90] at (y axis mid) {Income};
\end{tikzpicture}
\subsection{Curvas para dois casos}
\begin{tikzpicture}
\begin{axis}[
xlabel=$x$,
ylabel=$y$]
\addplot[smooth,mark=*,blue] plot coordinates {
(0,2)
(2,3)
(3,1)
};
\addlegendentry{Case 1}
\addplot[smooth,color=red,mark=x]
plot coordinates {
(0,0)
(1,1)
(2,1)
(3,2)
};
\addlegendentry{Case 2}
\end{axis}
\end{tikzpicture}
\end{document}
O PoliGNU é um grupo formado por estudantes de diversos cursos da Escola Politécnica, bem como de outros cursos da USP, que se dedicam ao desenvolvimento e à divulgação de tecnologia, software e cultura livres, especialmente no que se relaciona à engenharia. O grupo já tem mais de três anos de existência e é aberto à participação de quaisquer interessados(as).
Nosso mailing:
polignu(arroba)googlegroups(ponto)com

Exceto menção em contrário, todo o conteúdo deste site está licenciado sob uma
Licença Creative Commons Atribuição-Compartilhamento pela mesma Licença 3.0 Brasil.